Aggregated scoring data and tier list views in Google Sheets (SP view - DP view)
Sheets for SP 12-19 and DP 12-19 also available in document linked above
Above documents subject to change per improvements to the programs that generated them. Also bear in mind caveats raised later in the document regarding bpi/tier inflation for unlocks, extra exclusives, workarounds for handling MFC ties, etc..
(TODO: possibly collect, upload, and link various other files -- Python scripts, score HTMLs, SM files sourced from truebpm and elsewhere, the resulting JSONs with note data generated by smdataset, etc.)
See also other work in progress: Skill Attack score analyzer - instructions
IIDX Beat Power Indicator (BPI) was a system created by DJ Nori to compare the quality of scores between different songs with different notecounts. The formula produces a measure of the strength of a relative score given only four straightforward variables: the score to evaluate, kaiden average score, world record score, and maximum achievable score.
BPI follows a logarithmic progression with the kaiden average score assigned a value of 0 BPI, and the world record assigned a value of 100. A central concept of BPI is that it becomes exponentially more difficult to marginally raise a score as you approach the upper limit; the ratio of Just Greats to regular Greats must increase considerably.
Rather than spend a lot of time re-iterating in detail the motivation behind BPI and the math that supports it, here are some links to existing resources:
While we do have access to world records for every song chart, DDR does not have something equivalent to the “kaiden average” pacemaker to use as a source of data for BPI calculations. However, we do have an excellent source of player-submitted scores. DDR Skill Attack by @hiro_ddr is a site that implements a player rating system similar to GitaDora’s Skill Point. It also offers leaderboards for every song and chart in the game. Given that it has been adopted by players of a wide range of skill (from intermediate level to top rankers), it offers a nice sample of the overall playerbase.
One inconvenience is that DDR (and by extension, tools like Score Manager A and DDR Skill Attack that primarily interact with e-Amusement Basic Course as an alternative to manual data entry) track records in terms of weighted “money” score rather than EX score. Because the scoring weights for Perfect, Great, etc. can vary based on notecount, it’s important to re-normalize the scores to fixed-weight EX scores.
Thankfully, the scoring system in current versions of DDR makes it easy to determine EX from Perfect Full Combo scores, as well as get reasonable estimates of EX breakdowns for other general scores. (I’m continuing to experiment with estimating the proportion of greats vs. perfects vs. marvelouses etc., but I feel the basic method works well enough to use in BPI calculations for now. See “DDR scoring math” section later in the document for details. I came up with an estimation method that tackles from the opposite direction; given the premise that player timing will tend to fit a normal distribution, we can search for the value of standard deviation in frames that produce a set of judgements that fit the given money score. See “Estimating EX” section later in the document.)
As Exy touches on in his presentation on BPI, we can use a BPI calculator to examine how hard it is to achieve a given grade/percentage between different songs -- we simply use the percentage of max EX for each song as the score value input in the BPI function. As such, we can create a tier list by sorting all songs by the BPI for achieving a given percent score.
Minor note: since grades in DDR are based on money score, we can’t exactly compare the difficulty to achieve AAA, AA+, etc. on a given song; the percentage of EX represented by a grade will vary from song to song based on the total number of notes in each. Instead, we should create our tier list based on a fixed percentage of EX.
In the current state of the tier list I created, I chose to compare BPI to achieve 90% EX on all charts. I chose this threshold as (at least given the current money-to-EX estimation method) it has been achieved on the majority of charts. I wanted to select a percentage high enough to properly compare high-level scores while limiting the number of ties that must be broken by other means.
(If the selected percentage is above the world record, then the BPI calculator will just return 100. However, we could also either use a secondary sorting criteria or write a modified version of BPI for tier list generation that accounts for how much a given score would exceed the current world record. For now, in order to break the three-way tie at the top, I’m adding the result of a second BPI calculation with 90% EX compared to a lower bound of the world record and an upper bound of the max score; this should give a rough sense of the effort to exceed the current world record by that amount of EX.)
Exy also notes that BPI is sensitive to changes in the server record; as such, so is our tier list. For instance, if a particular chart has not been played often or very seriously by top rankers, the underdeveloped world record can reflect in an overrated position in the overall tier list. However, within the scope of a given difficulty folder, its position should give a good sense of how challenging it is to achieve a strong score.
Moreover, any songs that are currently (or have recently been) restricted to Extra Exclusive overrated due to the additional challenge of playing on Life 4; many players will not be able to clear the majority of the chart to set a strong average. Similarly, it’s also worth noting that IIDX allows players to play through to the end of a chart on normal lifebar and save a score, whereas DDR only saves a score up until the point that the lifebar is exhausted. On one hand, a low average on an song that is incredibly difficult to survive may in some sense be justified. On the other hand, inability to save a score beyond the point of failure represents a loss of information in how difficult it is to score on the chart overall.
Another caveat is that many more songs in DDR have been maxed multiple times over; this represents a type of “information ceiling” with regards to how hard a song is to score. However, we can account for this by using a weighted BPI for songs that have been maxed more than once. The method I’ve chosen for the time being is to invert the “BPI to estimated player rank” function from Norimiso’s BPI info page to break the multi-way tie. If 10 players have MFC’d a song, then we can calculate the hypothetical BPI for achieving 10th place out of that particular song’s overall player count. I then use this “10th place tie BPI” in place of the previous max value of 100. (We can also use extend this weighting concept to “negative BPI” by multiplying by 100 divided by the “new max value.”)
These caveats aside, it’s quite nice to be able to automatically generate a rough tier list based on real scoring data. :)
In my initial draft of the BPI spreadsheet, the scripts I wrote were attempting to back-calculate money score into judgement breakdowns in order to estimate EX score. The drawback to this approach is that there are many different ways to distribute the judgements and achieve the same money score. In order for money score reverse engineering to be viable, a good method of pruning away outlier distributions or hill climbing to one with the best fit to a normal distribution would be necessary. (Information about this back-calculation approach can still be read in the “DDR Scoring math” section below.)
Instead, in the current draft of the scripts, I approach the problem from the opposite direction; given the premise that most players’ timing will tend to follow a normal distribution, and given a hypothetical set of timing windows (I’m using the ones mined from DDR Extreme) we can search for the standard deviation from ±0.0ms that will produce the best fitting judgements to the observed target score.
I start with an arbitrary value for standard deviation and iterate from there. For each timing window “bucket,” I calculate the value of the cumulative distribution function for a normal distribution given a mean value of 0 (i.e., centered on “true marvelous”) and the hypothetical standard deviation to test. I then take the difference between each bucket to get a rough percentage of each judgement “observed” and multiply those percentages by the notecount. Given these estimated judgement breakdowns, I can calculate money score and EX score as usual. I choose a standard deviation very near zero (i.e., consistent MFC timing) and iterate via gradient descent, with target_score - hypothetical_score as the value to minimize.
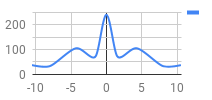
To give an example, let’s take a score of 993,870 on In Between ESP, which has 471 scoring targets. Let’s say that the real results screen showed 368 Marvelous + OK, 97 Perfect, and 6 Great, for a total of 1304 EX. The money-to-EX estimation process described above will come up with an estimate of ~370.53 Marvelous + OK, ~94.44 Perfect, and ~6.03 Great, for an estimated ~1306.49 EX.
Left: graph of observed judgements
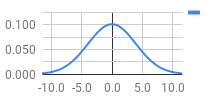
Right: graph of our estimated distribution (standard deviation of ~0.80355 frames ≈ 13.39ms)
This is a seems fairly reasonable for a quick estimate, without the need to consider the complexities and computational expense of back-calculating a list of possible real judgement breakdowns and searching for one with the best fit to a normal distribution.
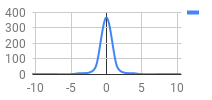
Let’s take a look at a far less optimized score as well: 706,970 on Valkyrie Dimension CSP, which has 756 scoring targets. Let’s say the results screen showed 241 Marvelous + OK, 146 Perfect, 210 Great, 64 Good, and 73 Miss, for a total of 1245 EX. Given that this looks like a barely passing score, it stands to reason that the estimation will not be quite as tight. The result produced is ~151.65 Marvelous + OK, ~142.22 Perfect, ~387 Great, ~62.60 Good, and ~11.93 Miss, for a 1126.98 EX.
Left: graph of observed judgements
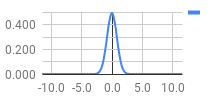
Right: graph of our estimated distribution (standard deviation of ~3.93521 frames ≈ 65.57ms)
It’s clear that using this estimation method will result in judgement breakdowns don’t account as well for a higher volume of notes being outright missed (as may be the case in very difficult song) than would be observed in a truly normal distribution. The estimated distribution will have fewer Marvelous (given that the distribution will flatten in such a way that will favor the Great window) and far fewer Miss (given that it’s an extreme outlier in the timing windows, rather than a result that would occur often if a player was able to read and execute on every note equally well). However, it’s somewhat interesting to see that the Perfect and Good judgements are actually quite close to reality. It’s ultimately not as tight of a fit as our other estimate, but the difference between the real value of 54.89% EX vs. an estimated 49.69% EX (~5.2% difference) at least gets us in the right ballpark to provide a lower bound for BPI calculation.
At the end of the day, we have to come to terms with the fact that, when working with money score when we’d rather have EX, we’re dealing with an unavoidable loss of information. We’re fortunate that Perfect Full Combo scores can be trivially converted to EX, and that other relatively high scores can be estimated fairly accurately. With barely passing (or even failing) scores, we’ll just need to move on knowing that the bounds on accuracy will necessarily decrease and that ultimately our estimate is just an estimate.
The DDR money score system works as follows: